Editor for Whiteboard Diagrams
Use the whiteboard diagram editor to visualize relationships between various diagrams and their elements.
Purpose
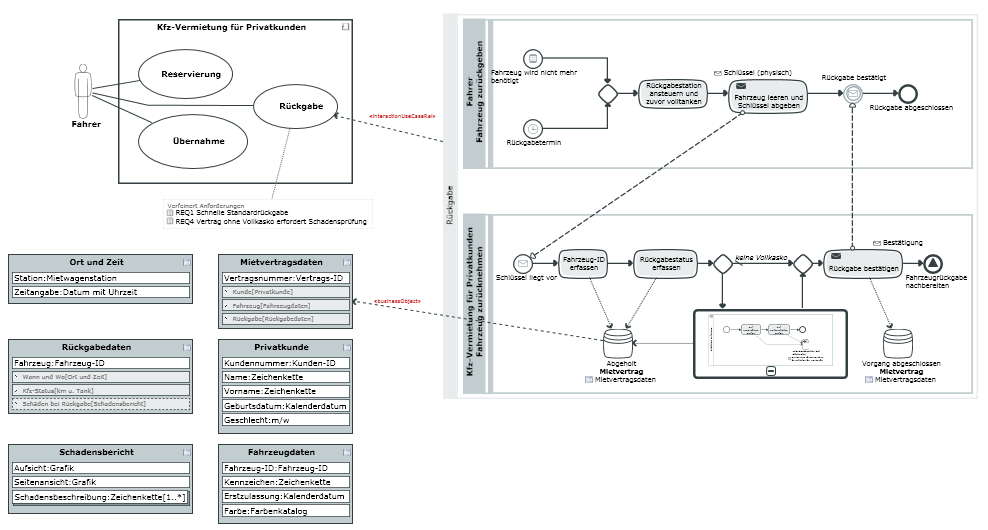
The whiteboard diagram is an overview diagram used for visualizing relationships between elements in different diagrams and elements of different notations. You can insert tables in the whiteboard diagram using diagrams which these tables appear in.
The whiteboard diagram is an Innovator-specific diagram type.
Supported Whiteboard Diagram Processes
Inserting Diagrams
You can drag a diagram template from the gallery or an existing diagram in the model structure and drop it in the whiteboard diagram to show it as a diagram node.
The following diagram types are possible, depending on the Innovator product you are using:
| Diagram Type | Innovator for Business Analysts |
Innovator for Software Architects |
Innovator for Information Architects |
Innovator for Enterprise Architects |
|
|---|---|---|---|---|---|
| New | Existing | ||||

|
|||||
| Process Map |
|
||||
| Business Resources Diagram and Organizational Chart |
|
||||
| Structure Diagram |
|
||||
| Diagram for Business Object States |
|
||||
| Decision Diagram |
|
|
|
|
|
| Use Case Diagram |
|
|
|
||
| Class Diagram |
|
|
|
||
| Java Class Diagram |
|
|
|||
| Component Diagram |
|
|
|||
| Composite Structure Diagram |
|
|
|||
| Deployment Diagram |
|
|
|||
| Activity Diagram | –* |
|
|||
| Sequence Diagram (Interaction) | –* |
|
|||
| State Diagram | –* |
|
|||
| Entity/Relationship Diagram |
|
||||
| Database Diagram |
|
||||
| Data Vault Diagram |
|
||||
| Dimension Diagram |
|
||||
| Cube Diagram |
|
||||
| Measures Dimensions Diagram |
|
||||
| ArchiMate® Diagram |
|
||||
* These behavior diagrams cannot be created without reference to a classifier (Behaviored Classifier) with the behavior they are describing. You can only drag these diagram types as existing diagrams from the model tree and drop them in the whiteboard diagram.
You can create elements in the respective diagram but you cannot create elements in the diagram node in the whiteboard diagram. Jump to the diagram in the respective diagram editor by double-clicking on the diagram.
You can select the diagram itself and a diagram's elements to e.g. modify their properties or dependencies.
Changes made to diagrams are shown immediately in the whiteboard diagram.
Visualizing Relationships
Depictable Relationships
Relationships can exist or be created in accordance with the relevant configuration as follows:
- Between diagrams
- Between diagrams and elements of other diagrams
- Between elements of different diagrams
You can show or hide existing relationships and create new relationships directly in the whiteboard diagram.
Showing or Hiding Relationships
You can show and hide relationships in the diagram using the normal method in the case of existing relationships.
Creating Relationships
When you create relationships, you can use the standard method and use the carousel to create a configured relationship.
There is normally already numerous relationships to certain element types that can be chosen from the carousel for a selected element or diagram. In the configuration, you can define diverse further relationship types between practically all diagram types and element types.
You can also create relationships for incoming and outgoing dependencies using the tool window Dependencies or the Dependency Editor.