The editor for Impact Analysis diagrams displays the interconnection of model elements using graphs. The display can be configured.
Purpose
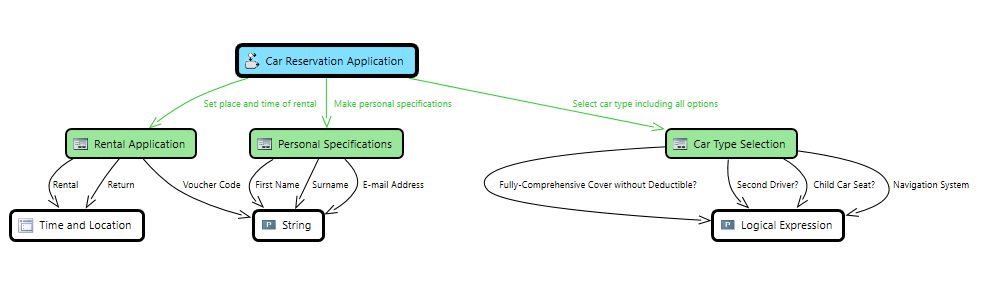
Impact analysis diagrams display the interconnection of a model element through its relationships with other model elements using analysis graphs.
You can configure how analysis graphs should appear. You can use the configuration content to specify which elements are used in the graph and whether they should be displayed as nodes or edges for simplicity. You can use the configuration of how elements are displayed in analysis graphs to set whether icons should be shown and whether and how properties should be shown. You can select the respective current configuration using the Impact Analysis tab and in the impact analysis Properties tool window. As well as the commands in the context menu for the diagram elements, you can also use the Impact Analysis Content and Impact Analysis Display tool windows for configuration modification.
The impact analysis diagram is an Innovator-specific diagram type.
Graph Area
You can select nodes or edges in graphs. The selection is adopted for Impact Analysis Content the and Impact Analysis Display tool windows.
You can show and hide an area that shows the diagram content as a (grouped) list using the View>Document Views>Diagram Content toggle command. Selecting something in the list selects the corresponding node or edge in the graph.
The path is shown as the tool tip for the nodes and edges. Each element in the path is shown with the icon, name and namespace name.
General
-
 Start analysis with selected element
Restart the impact analysis with the element selected in the graph.
-
 Add to end elements
The selected element is added to the end elements.
-
 Set as end element
The selected element is set as the end element and replaces the previously selected end elements.
-
Shortest Path
-
 Select Target
 Set the selected node as start node for the shortest path. Then select a node to show the shortest path to this node.
-
 Remove
Turn off the shortest path.
-
-
Result Region
-
 Add Selection
Add selected elements to the result region.
-
Add all graph nodes
All nodes of the graph are added to the result region.
-
Add all graph edges
All edges of the graph are added to the result region.
-
Add all source nodes to the selection
All source nodes of incoming relationships of the selected nodes are added to the result region.
-
Add all target nodes to the selection
All target nodes of outgoing relationships of the selected nodes are added to the result region.
-
Add All Nodes From the Shortest Path
All nodes from the shortest path are added to the result region.
-
Alternative Method When Selecting Nodes or Relationship Properties
-
 Filter Element
Filter this element.
-
Filter Stereotype
Filter all elements of this stereotype.
-
Filter Element Type
Filter all elements of this type.
-
Filter Property
Filter all edges of this relationship property.
-
 Edit Element Display
Edit the display of this element.
-
Edit Stereotype Display
Edit the display of all elements of this stereotype.
-
Edit Element Type Display
Edit the display of all elements of this type.
-
Edit Property Display
Edit the display of all edges of this relationship property.
Alternative Method When Selecting Path
-
Path - Filter Elements
The selected path is added in the content settings to the user-specific elements.
-
Path - Filter Stereotypes
The selected path is added in the content settings to the user-specific stereotypes.
-
Path - Filter Element Types
The selected path is added in the content settings to the user-specific element types.
-
Path - Edit Element Display
The selected path is added in the display settings to the user-specific elements.
-
Path - Edit Stereotype Display
The selected path is added in the display settings to the user-specific stereotypes.
-
Path - Edit Element Type Display
The selected path is added in the display settings to the user-specific element types.