The impact analysis diagram uses configurable graphs to visualize how model elements are connected.
You can use the established MID modeling tool to create Impact Analysis Diagrams.
Test the Innovator Enterprise Modeling Suite for free.
Definition
The impact analysis diagram is an Innovator-specific diagram type that visualizes the way a certain model element is connected.
You can set how the elements are taken into consideration when structuring the analysis graph and how nodes and edges are depicted.
 The icon shows a diagram with an analysis magnifying glass.
Use
You can use the impact analysis diagram to show a configurable analysis graph of a certain model element. This visualizes certain connections of the model element and its environment.
You can drag model elements from the model tree as start elements and drop them on the impact analysis diagram.
Impact Analysis Diagram Elements
The model elements to be displayed in the impact analysis diagram are automatically specified due to the settings for the obligatory start element, Graph Direction, Analysis Range, path length determined by the end element, content configuration etc.
Model elements are displayed as nodes or edges as standard as is the case in the underlying notation.
Due to the configuration of content of an analysis graph, certain edge-node-edge sequences are shown as edges to make the analysis graph easier to understand.
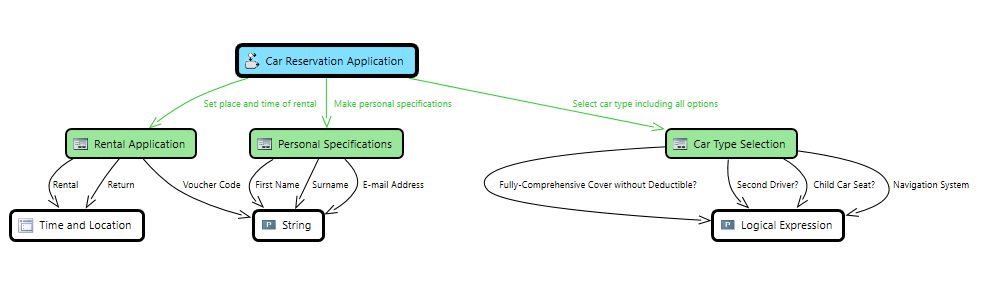
Example for an Impact Analysis Diagram