Diagram Editors
You can edit graphic representations of structures, relationships and flows in diagram editors.
General Functions
You can edit graphic representations of structures, relationships and flows in diagram editors. The basic functions are the same in all diagram editors.
You open all diagram editors by creating or opening the corresponding diagram type.
You can use the Design tab to drag an element from the gallery in the ribbon and drag it in the diagram. You can link these diagram nodes with diagram edges available in the diagram node's context menu and, in doing so, model relationships and flows.
Numerous further functions are available to you in diagram editors, e.g.:
-
Framing diagram elements
-
Coloring diagram elements
-
Identifying elements with smart icons
-
Storing notes about elements in the diagram
-
Showing and hiding relationships, callouts, comments and notes
-
Displaying Elements in an Alternative Language
Navigate to a selected diagram's position:
-
In the diagram hierarchy with the context menu command Go to>Position in the Diagram Structure (Ctrl+Shift+D)
-
In the model hierarchy with the context menu command Go to>Location in Model Structure (Ctrl+M)
-
In the model element list with the context menu command Go to>Location in Model Element List (Ctrl+Shift+M)
Navigate to a selected diagram element's position:
-
In the model hierarchy with the context menu command Go to>Location in Model Structure (Ctrl+M)
-
In the model element list with the context menu command Go to>Location in Model Element List (Ctrl+Shift+M)
Diagram Types
Special Concepts
There are special prerequisites and automatisms for certain diagram types. UML activities (activity diagrams) and UML state machines (state diagrams) cannot be created without reference to a classifier (behaviored classifier) with the behavior they are describing. These automatic processes are there to make things easier for you and help maintain consistency in diagrams (keyword: special concepts).
Note
All diagram elements have a minimum size that cannot be changed. The dashed line under the head of a lifeline, for example, is at least 15 raster cells high.
Figure: Diagram Types
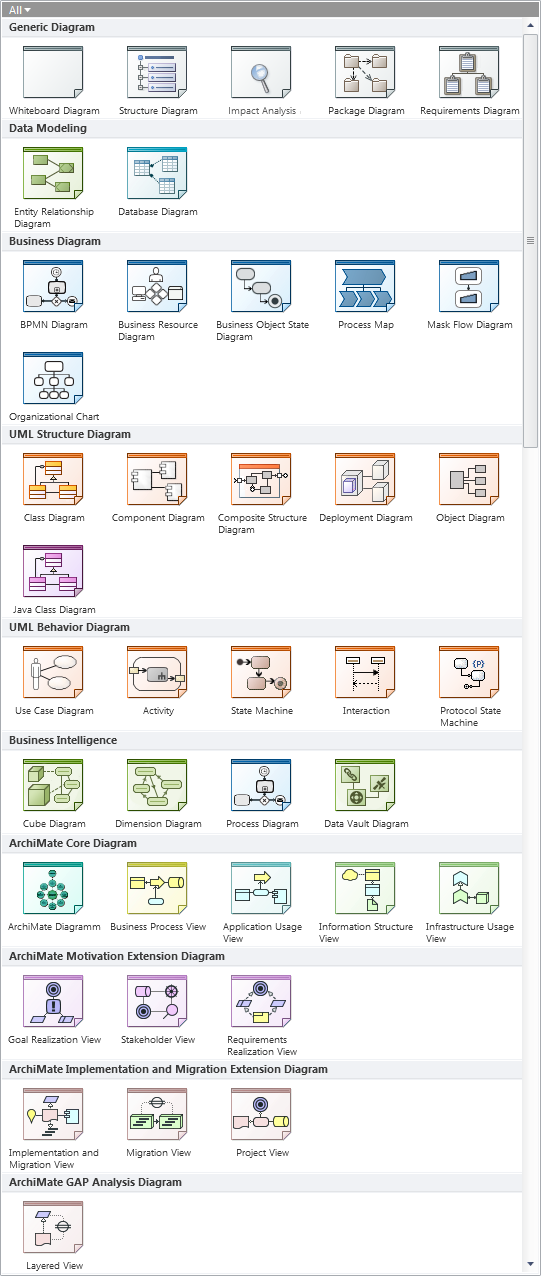
Diagram Groups
Innovator groups the diagram types to enable a better overview. The following are important diagram groups, for example:
-
Generic Diagrams
Generic diagrams do not use a standardized notation; instead, they depict Innovator-specific combinations (whiteboard diagrams) or contents (structure diagrams, requirement diagrams).
-
Data Modeling
Entity relationship diagrams and database diagrams use the IMM standard with all common ER notations or, for DB diagrams, with the IDEF1X notation.
-
UML Structure Diagrams
UML structure diagrams depict the structure and dependencies of a modeled system.
-
UML Behavior Diagrams
UML behavior diagrams show a certain view of the dynamic aspects of the modeled system.
-
Business Diagrams
Business diagrams implement the Business Process Model and Notation (BPMN) and Decision Model and Notation (DMN) standards, provide supplementary displays, or relate directly to such diagrams (process maps).
-
Business Intelligence Diagrams
Business intelligence diagrams use ER notation to implement the Data Vault 2.0 standard and multidimensional modeling or the BPMN process diagram to display data origin.
-
ArchiMate® Diagram
ArchiMate® diagrams implement the various ArchiMate® viewpoints.
-
Concept diagrams (in various groups)
The generic concept diagrams describe certain simple connections between concept nodes using concept connections.
Concept diagrams include e.g. the process map and ArchiMate® diagrams.
Classifier Diagrams
Some functions (e.g. display options) are made available for certain diagram types of different groups, e.g. for so-called classifier diagrams. They depict the structure of a metamodel element of the "Classifier" type.
Classifier diagrams are the following diagrams in Innovator:
- Class and object diagram
- Use case diagram
- Component and package diagram
- Composite structure diagram
- Deployment diagram
- ER diagram (incl. data vault diagram, cube diagram, dimension diagram)
- DB diagram
- Structure diagram
This chapter contains the topics: