Innovator for Information Architects provides you with various diagrams and tables, a specification editor and other resources for developing your project.

|
Entity/Relationship DiagramsEntity relationship diagrams graphically display a partial model of the conceptual schema. Entities are shown as nodes and relationships are shown as edges. The user can choose the notation they want in Options. |

|
Database DiagramsDatabase diagrams show a submodel of the database schema. Database tables are shown as nodes and foreign keys as edges. Innovator uses the IDEF1X notation. Database views can also be displayed as nodes and their From clauses as edges. |

|
Table Editors for Editing Entities, Tables and ViewsA table contains all of an element's subelements of a certain type respectively, e.g. all attributes of an entity. |
|
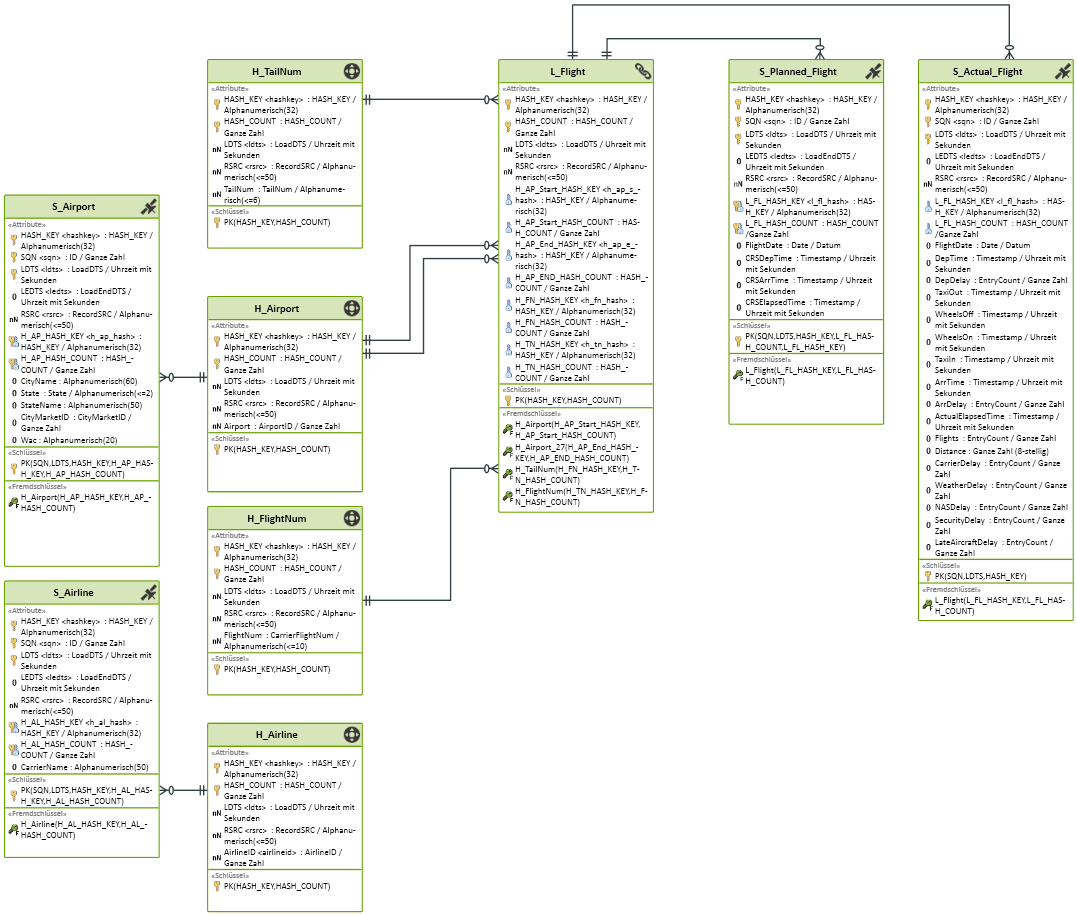
Data Vault DiagramsData Vault diagrams display object information and its relationships in the Data Warehouse. Use it to create a normalized model of your data object without redundancies. |

|
Dimension DiagramsDimension diagrams display dimensions and hierarchies as container nodes. They display the dimension levels and hierarchy levels with compartments for identification, display, and sort attributes. The dimension precedences are depicted as edges between the levels. |

|
Cube DiagramsCube diagrams display the analysis possibilities of multidimensional OLAP cubes to enable the coordination of specifications, for example, when communicating with specialist departments in the Business Intelligence area. The cubes and cube dimensions are displayed as nodes and the hierarchies they use are displayed as container nodes. The usage of hierarchies and the dimension precedence is displayed using edges. |

|
Measures Dimensions DiagramMeasures dimensions diagrams portray cubes and their dimensions. A cube dimension directly shows the dimension level and is linked to the fact set with a key in the ER model. |

|
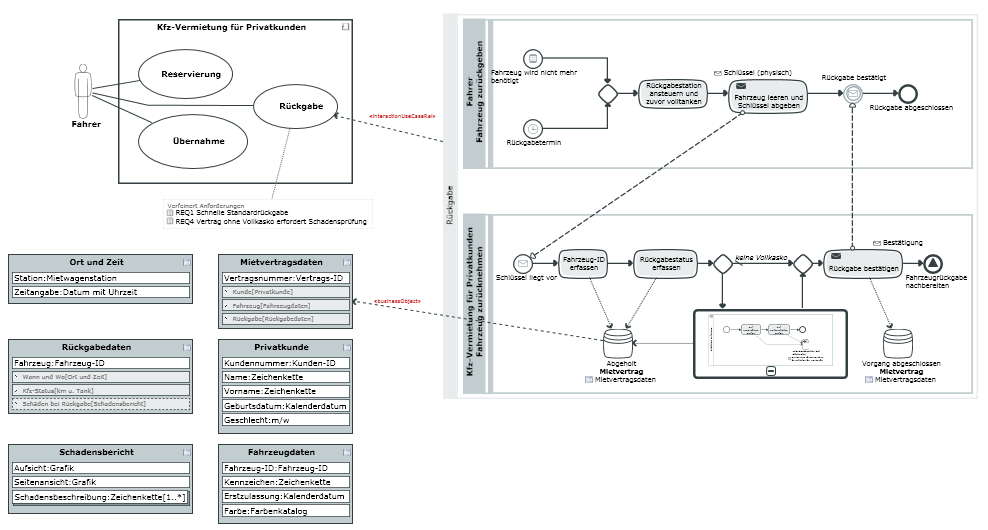
Process DiagramsIn the Business Intelligence context, process diagrams display the processes for acquiring and processing data from the operational systems to the data warehouse. |
|
Whiteboard DiagramsWhiteboard diagrams enable visualization of relationships between model elements which would otherwise have to be visualized in different diagram types. |
Other Editors
There are special editors for certain functions; these interfaces can be called many times.

|
Specification Texts for Describing Model Elements and RequirementsYou can store descriptive texts for Innovator elements as specifications; these can then be used e.g. in model documentation. Requirements form the basis of every development project, regardless of whether it is a new development or working on an existing project. |

|
Impact AnalysisImpact analysis uses analysis graphs to depict the interconnection of model elements. The display can be configured. |

|
Mapping EditorThe Mapping editor is for the highly configurable mapping of elements from one model to elements of another model. For example, in this way you map tables, columns and keys of a database model to entities, attributes and keys of a conceptional model. |

|
Dependency EditorThe Dependency Editor is used for easily editing dependencies between various elements independently of a diagram. |

|
BeamerThe Beamer tool window supports the role-based, flexible and transparent mapping of elements and can be configured in many ways. |

|
Align ModelsThe Align Models editor is used for comparing elements from the current model or from the current model and another one. You can use filters to make the evaluation easier to read. |